Base de Conhecimento
How to Run a Traceroute on a Windows Computer? Imprima este artigo
Mastering Traceroute on Windows: A Step-by-Step Guide to Troubleshoot Network Issues
Have you ever wondered how data travels from your computer to a website halfway across the globe? Traceroute is like a digital map that reveals this journey, pinpointing every stop along the way. If you're using Windows OS and want to explore the path your data takes, you’re in for an enlightening experience. This handy tool not only helps diagnose network issues but also enhances your understanding of internet connectivity. Ready to dive into the world of tracerouting? Let’s unravel its mysteries together!
What is Traceroute?
Traceroute is a network diagnostic tool that tracks the path packets take from one computer to another. It reveals each hop along the route, showing how data travels through various routers and networks.
This tool sends out a series of specially crafted packets to the destination address. As these packets make their way through intermediaries, they gather information about each stop’s response time and IP address.
By analyzing this journey, users can identify potential bottlenecks or failures in connectivity. This insight is crucial for troubleshooting network issues or optimizing performance.
Traceroute works by using Internet Control Message Protocol (ICMP) echo requests or User Datagram Protocol (UDP) datagrams to communicate with devices along the path. The results provide valuable information about latency and routing behavior across the internet landscape.
Benefits of Using Traceroute in Windows OS
Traceroute is a powerful tool for network diagnostics. It helps identify the path your data takes to reach its destination. Understanding this route can clarify where potential issues may be arising.
Using traceroute in Windows OS allows users to pinpoint latency or slow connections between nodes. This insight can significantly aid in troubleshooting connectivity problems.
Another advantage of running traceroute is its ability to visualize network hops. Each hop represents a point along the journey, making it easier to see where delays occur.
Moreover, it provides valuable information about each node's response time. This helps networks optimize performance by highlighting bottlenecks that need attention.
For IT professionals and tech enthusiasts alike, traceroute serves as an essential part of any toolkit for maintaining efficient networks and resolving issues swiftly.
How to Run Traceroute in Windows
Step 1: Open the Command Prompt
To run Traceroute in Windows, you need to access the Command Prompt. Here’s how:
- Press Windows + R: This will open the Run dialog.
- Type
cmd: Then hit Enter or click OK. This will open the Command Prompt window.
Step 2: Use the Tracert Command
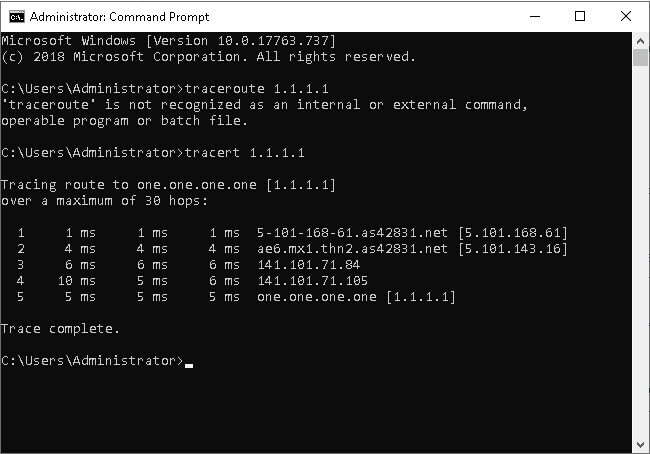
Windows does not use the command traceroute, but instead employs the tracert command. Here’s how to use it:
-
In the Command Prompt: Type
tracert [destination], replacing[destination]with the website or IP address you want to trace. For example:
-
tracert google.com -
Press Enter: The Tracert command will begin executing. You will see output like the following:
-
Tracing route to google.com [172.217.11.46]
over a maximum of 30 hops:

  1     <1 ms     <1 ms     <1 ms  192.168.1.1
  2     10 ms     12 ms     10 ms  10.0.0.1
  3     20 ms     19 ms     18 ms  172.217.11.46

Trace complete.
Step 3: Analyzing the Results
The output will display several pieces of information for each hop:
- Hop Number: The sequence of the hop from your computer to the destination.
- Response Time: The time (in milliseconds) it takes for packets to travel to that hop and back.
- IP Address: The IP address of each router along the path.
- Destination Hostname: If available, the name associated with the IP address.
Step 4: Understanding Latency and Packet Loss
- Latency: Measured in milliseconds (ms), it indicates how quickly a response is returned. If a hop shows high latency (e.g., over 100 ms), it may indicate network congestion or issues with that router.
- Packet Loss: If a hop times out (you see
* * *), packets were lost at that point, which could point to an issue in the network path.
Troubleshooting Common Issues
- Command Not Found: Ensure you're typing
tracertcorrectly in the Command Prompt. It is case-sensitive. - Timeouts: If you experience consistent timeouts, the destination host may be blocking ICMP packets, which are used for traceroute.
- High Latency Values: If you identify high latency at any hop, it could indicate network congestion or an overloaded router. Consider using a different path or contacting your Internet Service Provider (ISP).
Frequently Asked Questions (FAQs)
1. What is the difference between Traceroute and Tracert?
Traceroute is commonly associated with Linux and Unix systems, while Tracert is the equivalent command in Windows.
2. How can I save Tracert results to a file?
You can redirect the output of the Tracert command to a text file by using the following command:
tracert google.com > tracert_results.txtThis will create a text file named tracert_results.txt in the Command Prompt default directory.
3. Why do some hops show asterisks ( * ) in Tracert results?
Asterisks indicate that no response was received at that hop. This could be due to packet loss, firewall settings, or the host not responding to ICMP requests.
4. How many hops can Tracert track?
By default, Tracert in Windows can track a maximum of 30 hops to a destination. You can change this number using the -h option, for example:
tracert -h 20 google.com5. Is there an equivalent Traceroute tool for Linux?
Yes, the command traceroute is used in Linux and macOS systems. The syntax is similar, but it may have additional options.
Alternative Tools for Traceroute on Windows OS
While the built-in traceroute tool in Windows is handy, there are several alternative tools that can enhance your network diagnostics.
One popular option is WinMTR. This combines the functionality of ping and traceroute, providing real-time analysis of packet loss and latency along each hop. The interface is straightforward and user-friendly.
Another choice is PathPing. This command-line utility offers a blend of ping and traceroute features but goes further by analyzing route quality over time. It’s particularly useful for identifying unstable connections.
For those who prefer graphical interfaces, SolarWinds Traceroute NG stands out. It's packed with additional features like visualization capabilities to help users easily interpret their results.
Angry IP Scanner can also perform basic traceroutes alongside its primary function as an IP address scanner. Its flexibility makes it a valuable addition to any network toolkit.
Tips for Interpreting Traceroute Results
Interpreting traceroute results can feel overwhelming, but it doesn't have to be. Start by looking at the response times for each hop. A significant delay may indicate network congestion or potential issues with that particular node.
Pay attention to the IP addresses returned in the results. This information helps identify where delays are occurring along the path to your destination. If you see an asterisk (*) instead of a time, it means there was no response from that hop; this could signify packet loss or firewall rules blocking responses.
Look for patterns in latency as well. Consistent high numbers across multiple hops suggest a broader issue within that segment of the network.
Context matters—compare results against expected performance metrics and investigate further if something seems off. Understanding these nuances will empower you to troubleshoot more effectively and communicate issues clearly with your service provider.
Understanding how to run a traceroute in Windows OS opens up a world of insights into your network's performance. With its ability to reveal the path data takes across the internet, it becomes an invaluable tool for troubleshooting connectivity issues. Whether you’re trying to diagnose slow internet speeds or pinpoint where packets are being dropped, knowing how to effectively use traceroute can empower you.
While there may be some common pitfalls when using this command-line utility, familiarizing yourself with its operation makes it easier to interpret results and troubleshoot issues efficiently. If built-in tools aren't meeting your needs, numerous alternatives offer similar functionalities that might better suit specific situations.
Arming yourself with these skills not only enhances your technical know-how but also improves your overall experience online. Embracing tools like traceroute adds depth to how we navigate the complexities of digital communication, making us more informed users in today's interconnected world.
Esta resposta foi útil?
Artigos Relacionados
Hi Thank you for choosing service from Host4Fun . Go to run > cmd > slmgr.vbs /rearm and...
By default Windows Server 2008 firewall blocks ping requests. To enable please follow the...
By default Windows Server 2012 firewall blocks ping requests. To enable please follow the below...
Hi , Thank you for choosing Service from Host4Fun.Com. When we run command "yum update" on our...
For Guide Visit :...